Phase 2: Build & Test
Once you launch a build, Rogue Architect transitions into active building mode. The canvas becomes a real-time monitoring dashboard where you can watch VMs come up, plugins execute, and debug issues as they happen.
What You’ll See
Section titled “What You’ll See”Compact status bar
Section titled “Compact status bar”The bottom of the canvas always shows a compact status bar — overall status badge, total plays completed out of all plays, tasks remaining, elapsed time, and the Redeploy Build / Remove Build actions.
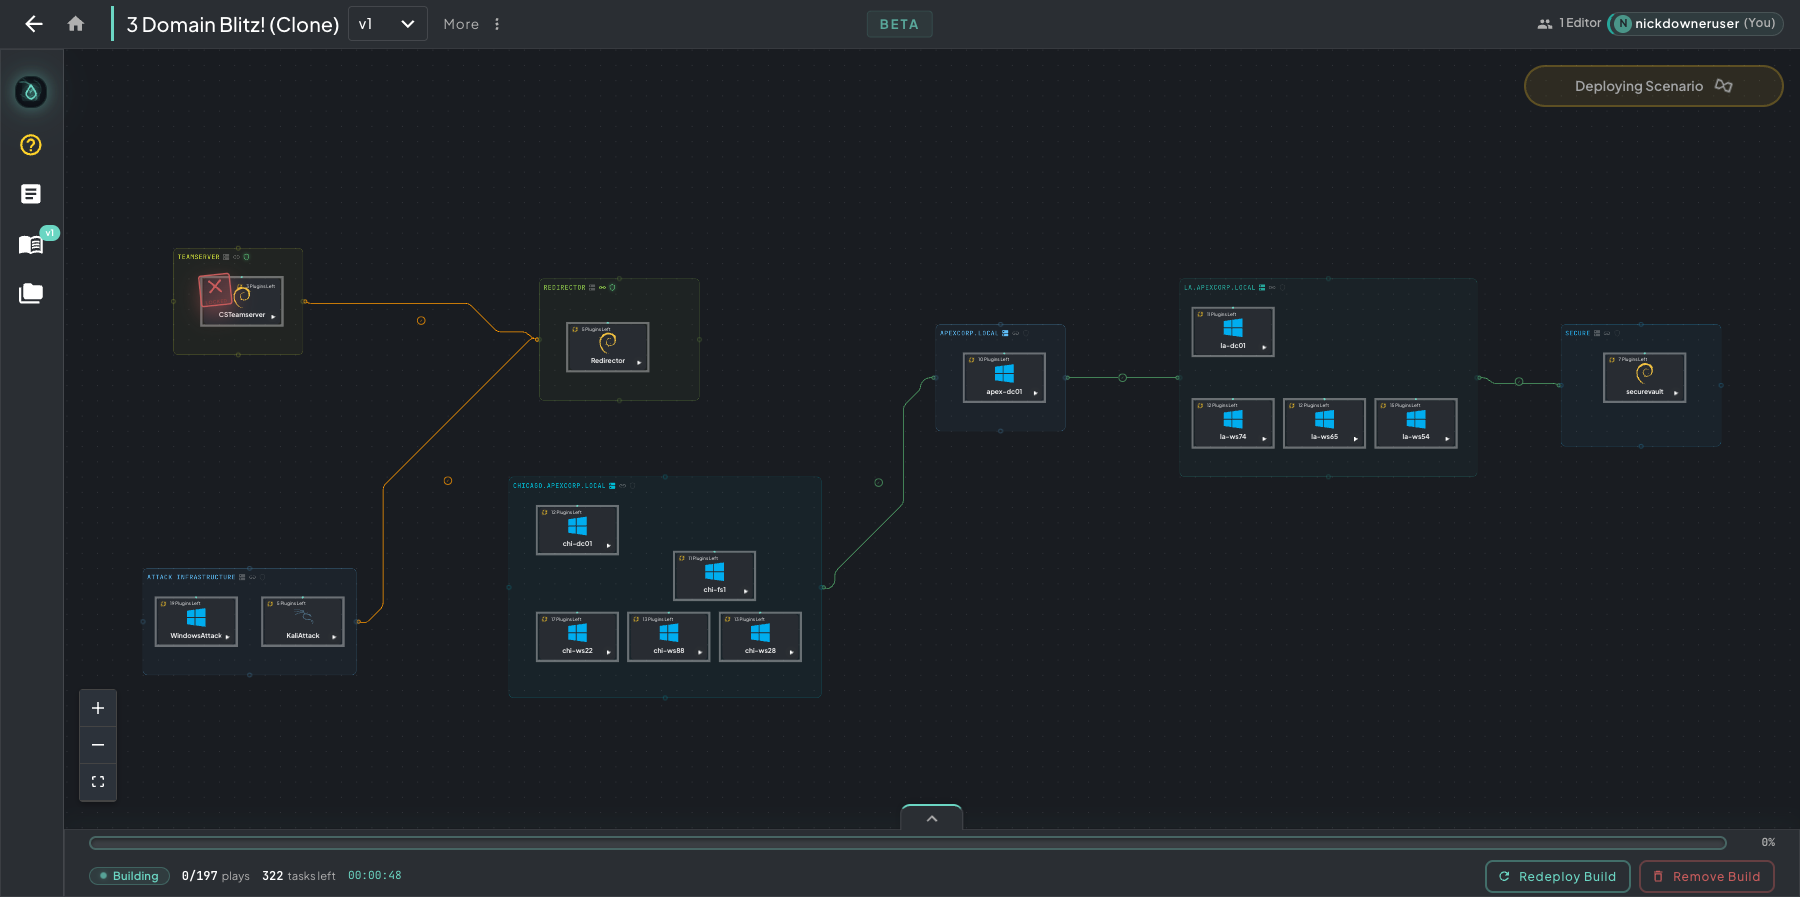 Compact status bar — total plays and tasks left always visible in the lower-left so you can glance at progress without leaving the canvas.
Expanded dashboard
Section titled “Expanded dashboard”Click the caret in the middle of the bar to expand it into the full monitoring dashboard — the 6-phase pipeline strip up top (Clone Infra → Clone VMs → Start Infra → Start VMs → Build Steps → Complete), the current build status card on the left (plays, tasks, build options), an activity feed in the middle, and Default Machines / Build Infra tabs on the right.
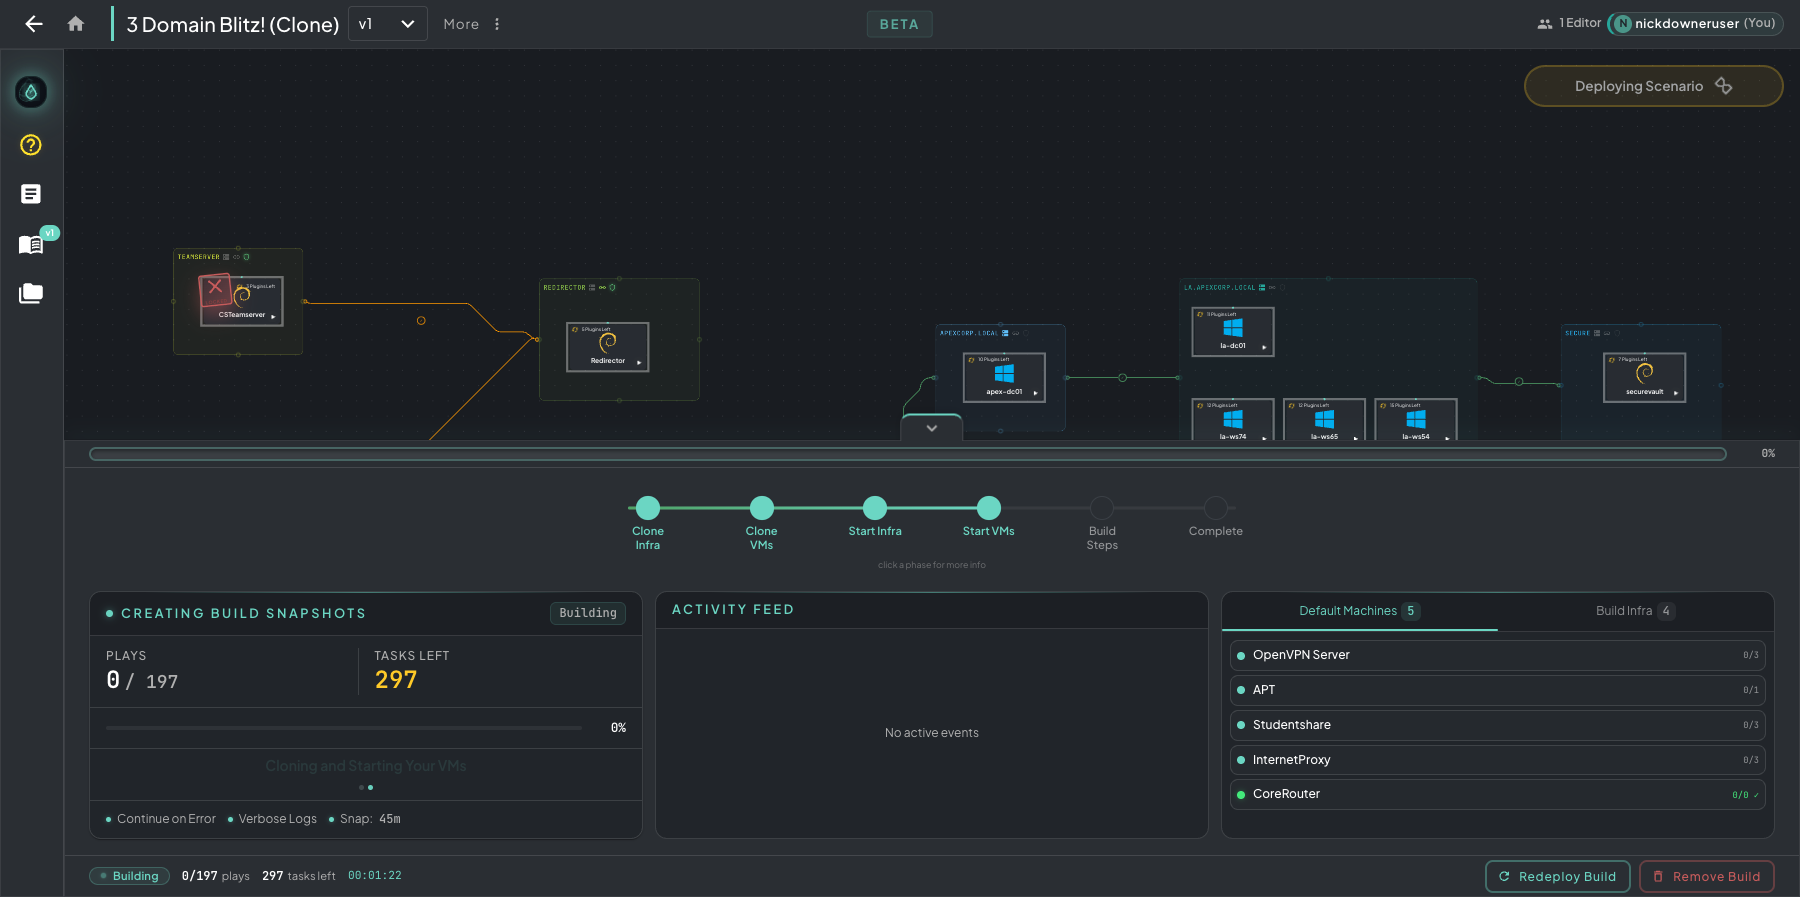 Expanded view — pipeline strip, plays/tasks status card, activity feed, and the machine tabs all in one panel.
Per-machine progress on the canvas
Section titled “Per-machine progress on the canvas”Every machine card shows its Plugins Left counter and gets a small green dot once it’s online. The ▶ play button in the lower-right of each card opens a live VM viewer so you can step into the machine and watch plugins land in real time.
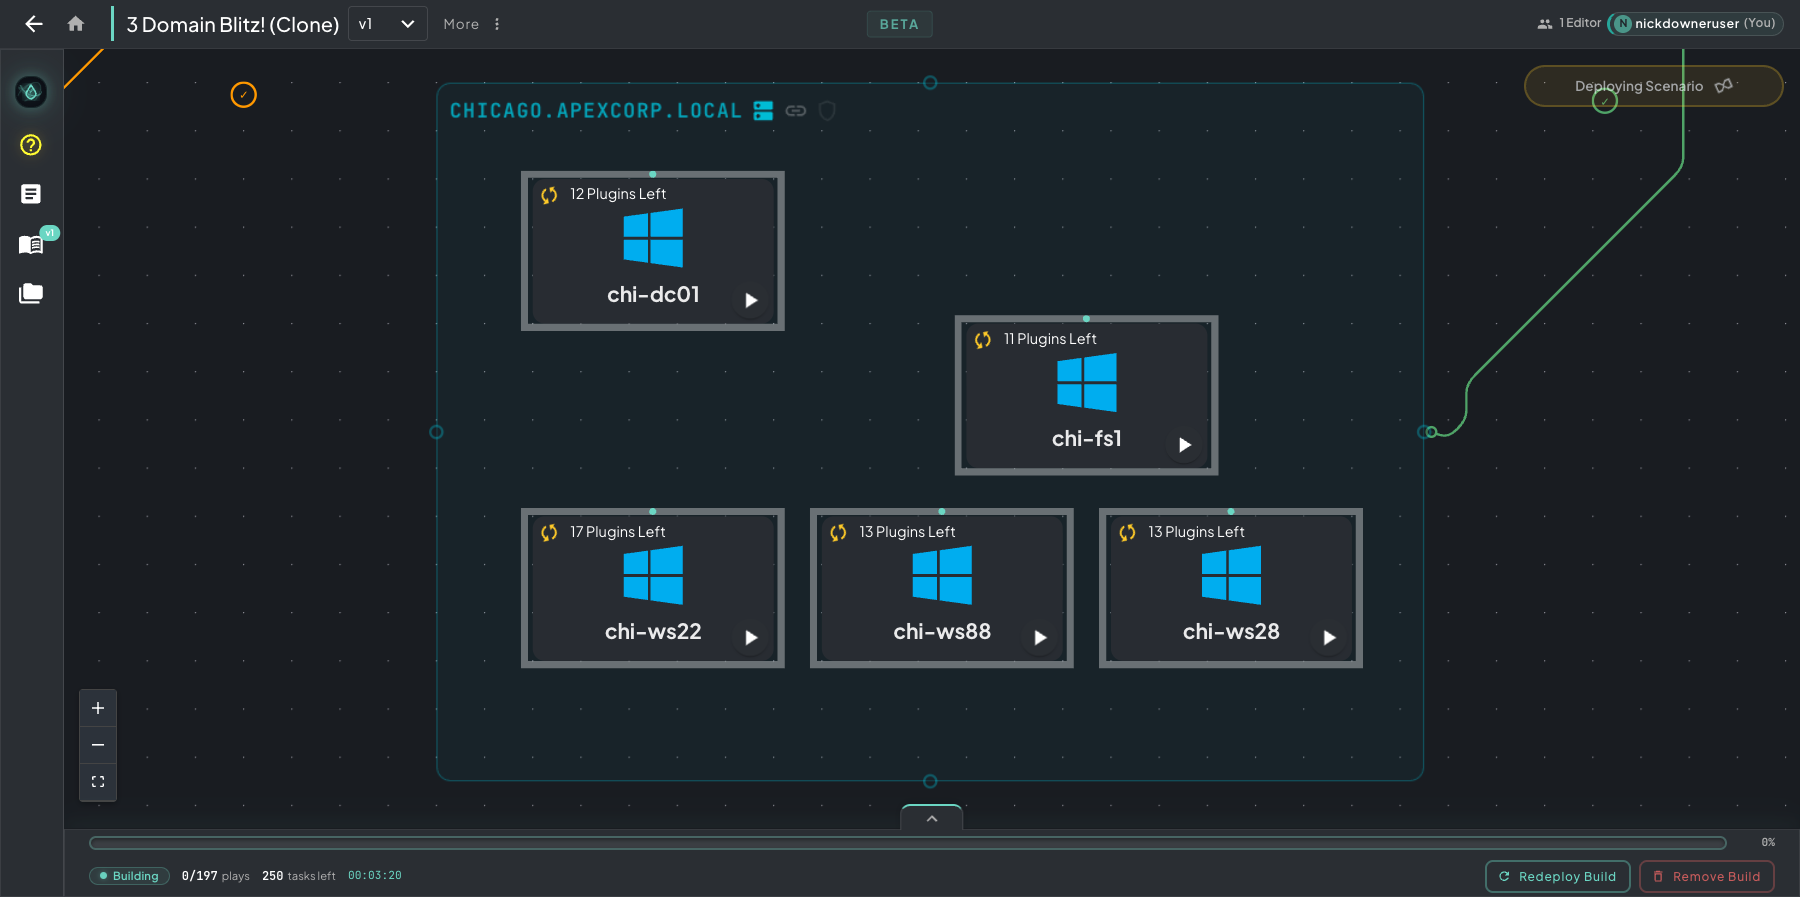 Per-machine plays right on the canvas — plugins remaining counter, green online dot, and a play button to pop open the VM viewer while the build runs.
Left rail
Section titled “Left rail”The left rail expands during a build, surfacing Help Me!, Logs, Curriculum, and Vaults alongside the always-available Rogue Oracle.
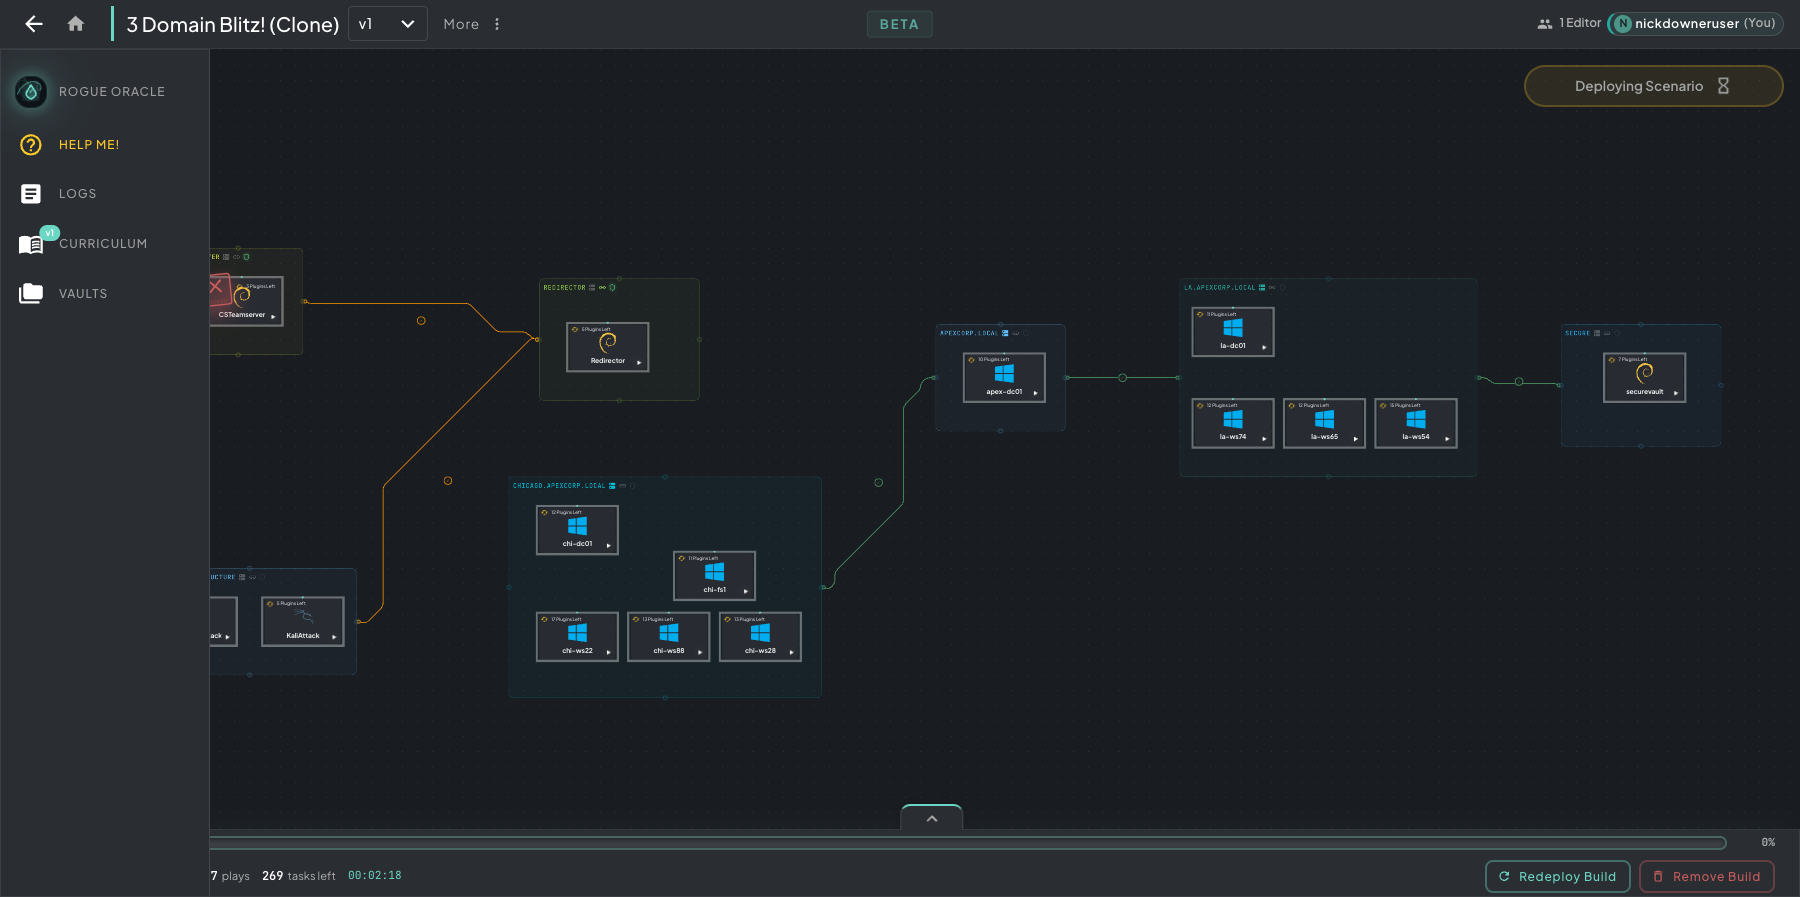 Left rail during a build — Help Me is the suggested first stop, Logs streams live events, and Curriculum/Vaults stay one click away.
Logs, Errors, and Redeployment
Section titled “Logs, Errors, and Redeployment”If a build fails or errors during execution, the sections below walk through diagnosing the failure (logs and Ansible output), interpreting the error state on the canvas, and recovering via snapshot redeployment — usually without rebuilding from scratch.
When something errors
Section titled “When something errors”Behavior depends on your Continue on Error setting — off stops at the first failure, on keeps going and flags errored plugins so you find every issue in one run.
1. Spot the errored host on the canvas. Successful machines stay teal with a “Done!” badge. Any machine with a failed plugin goes red and shows a count badge in the corner with the number of errored plugins. The status pill in the top-right flips to Scenario Build Errored.
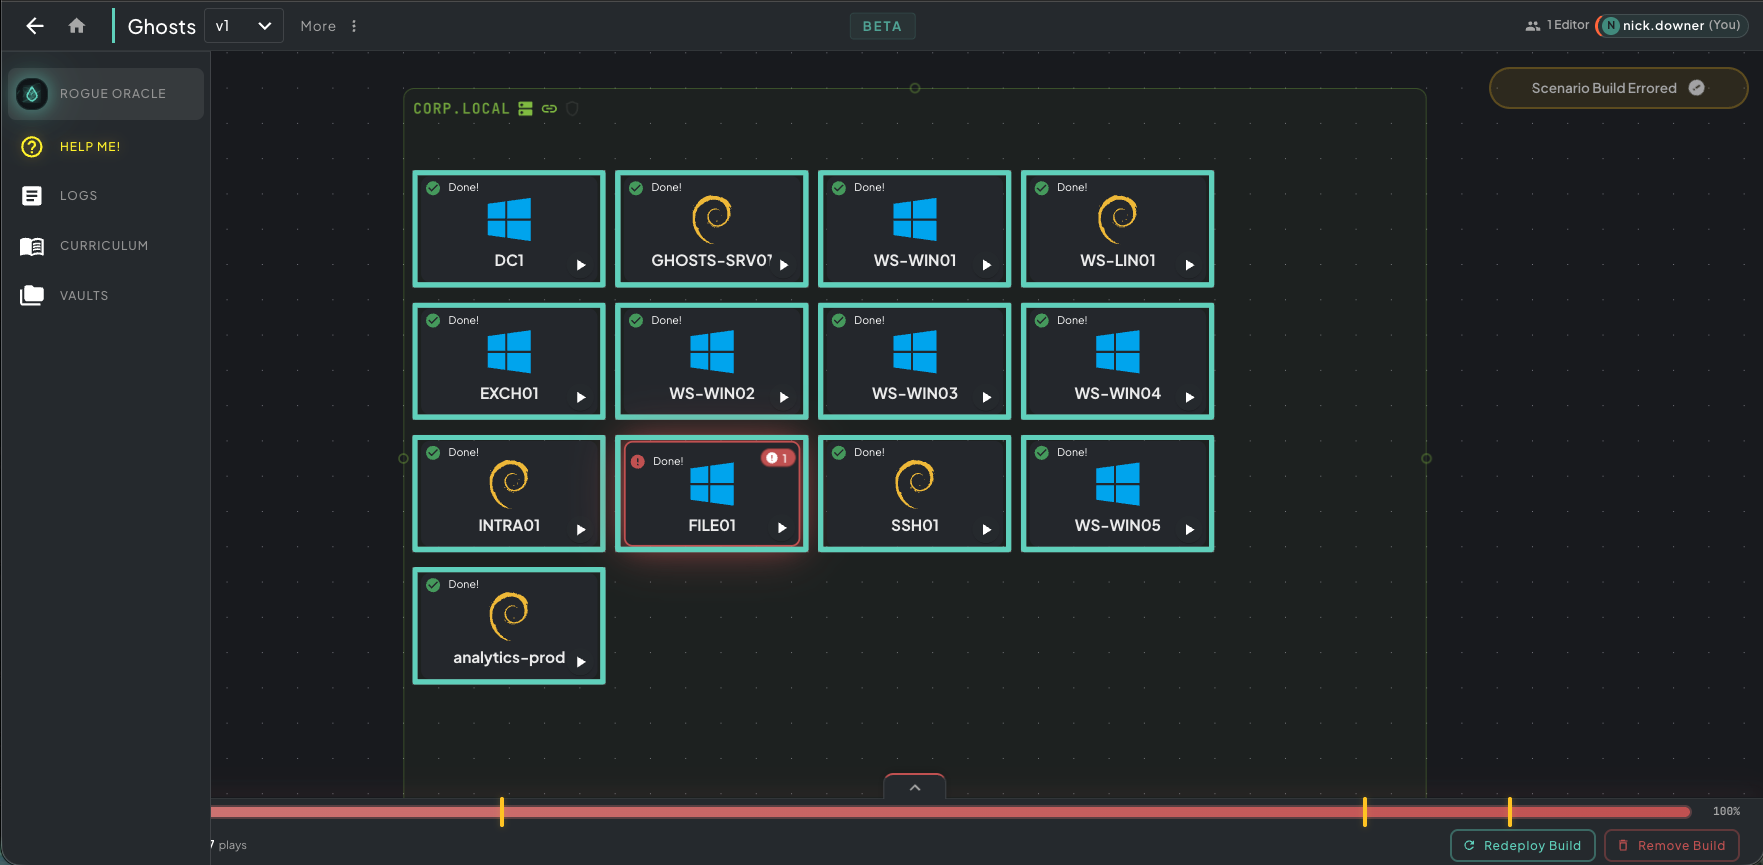 FILE01 went red with a
 1 badge in the corner — one plugin on that machine errored. Every other machine in the VLAN finished cleanly.
2. Single-click the host to open its play list. A single click on the red machine opens the Build Progress panel on the right, listing every play the machine ran. Successful plays are marked Installed in green; the failed play is marked errored in red with a file icon to view its log.
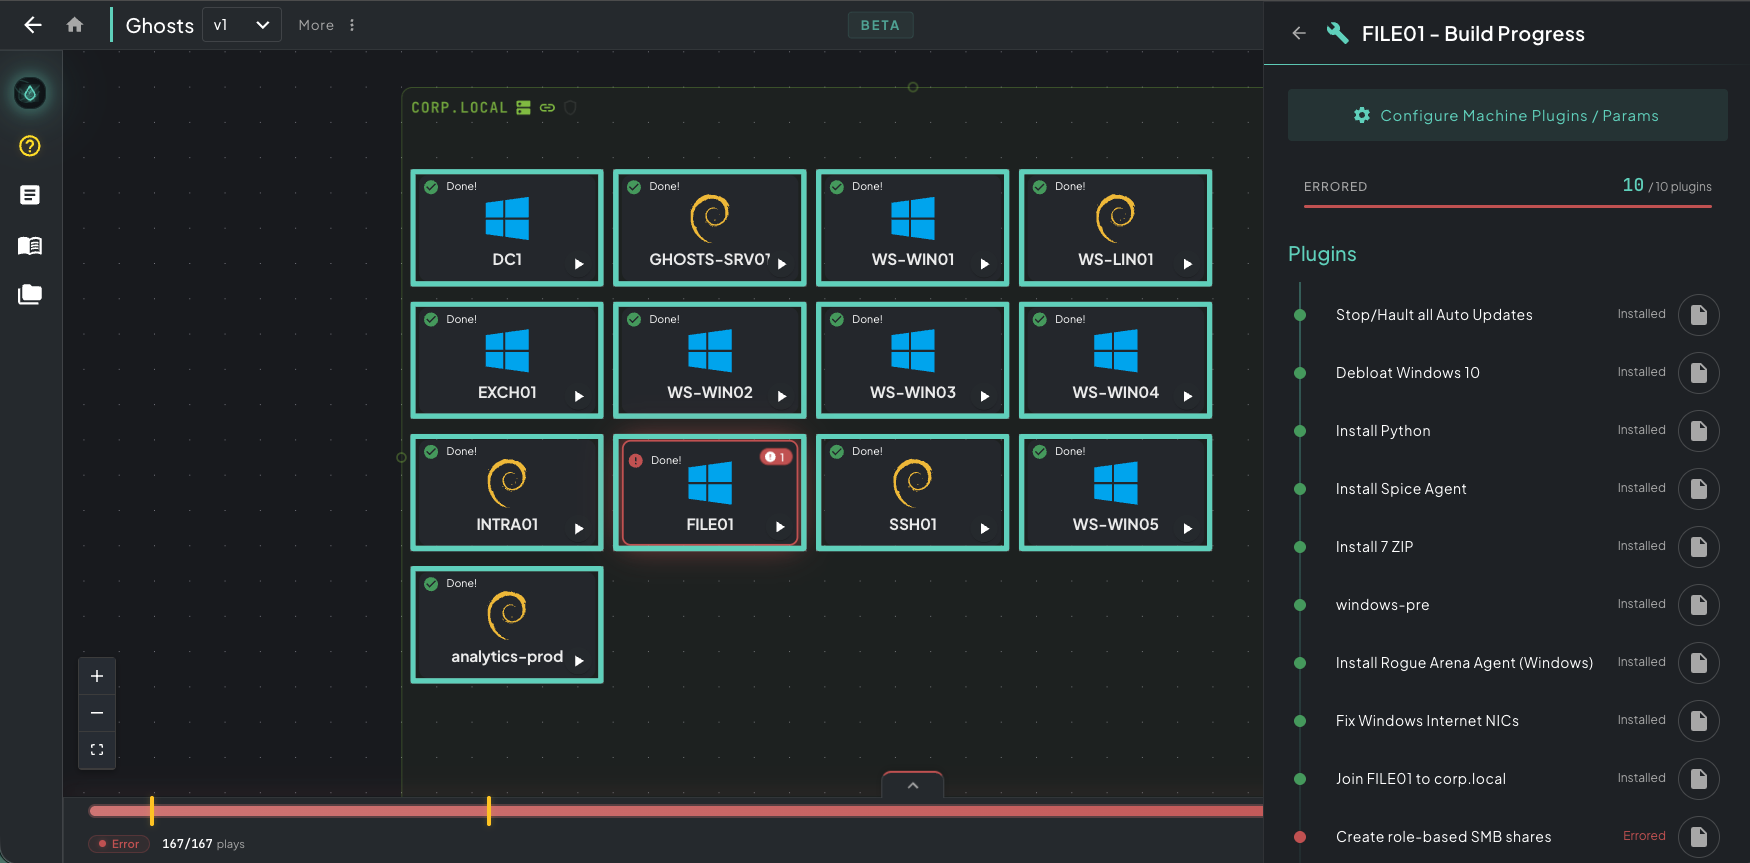 Build Progress panel — every play on FILE01 listed with status. The errored “Create role-based SMB shares” play is flagged red at the bottom of the list.
3. Click the file icon to open the Ansible log for the failed play. A full Monaco viewer opens showing the entire Ansible run for that specific play — PLAY/TASK headers, color-coded status markers, and FATAL lines highlighted.
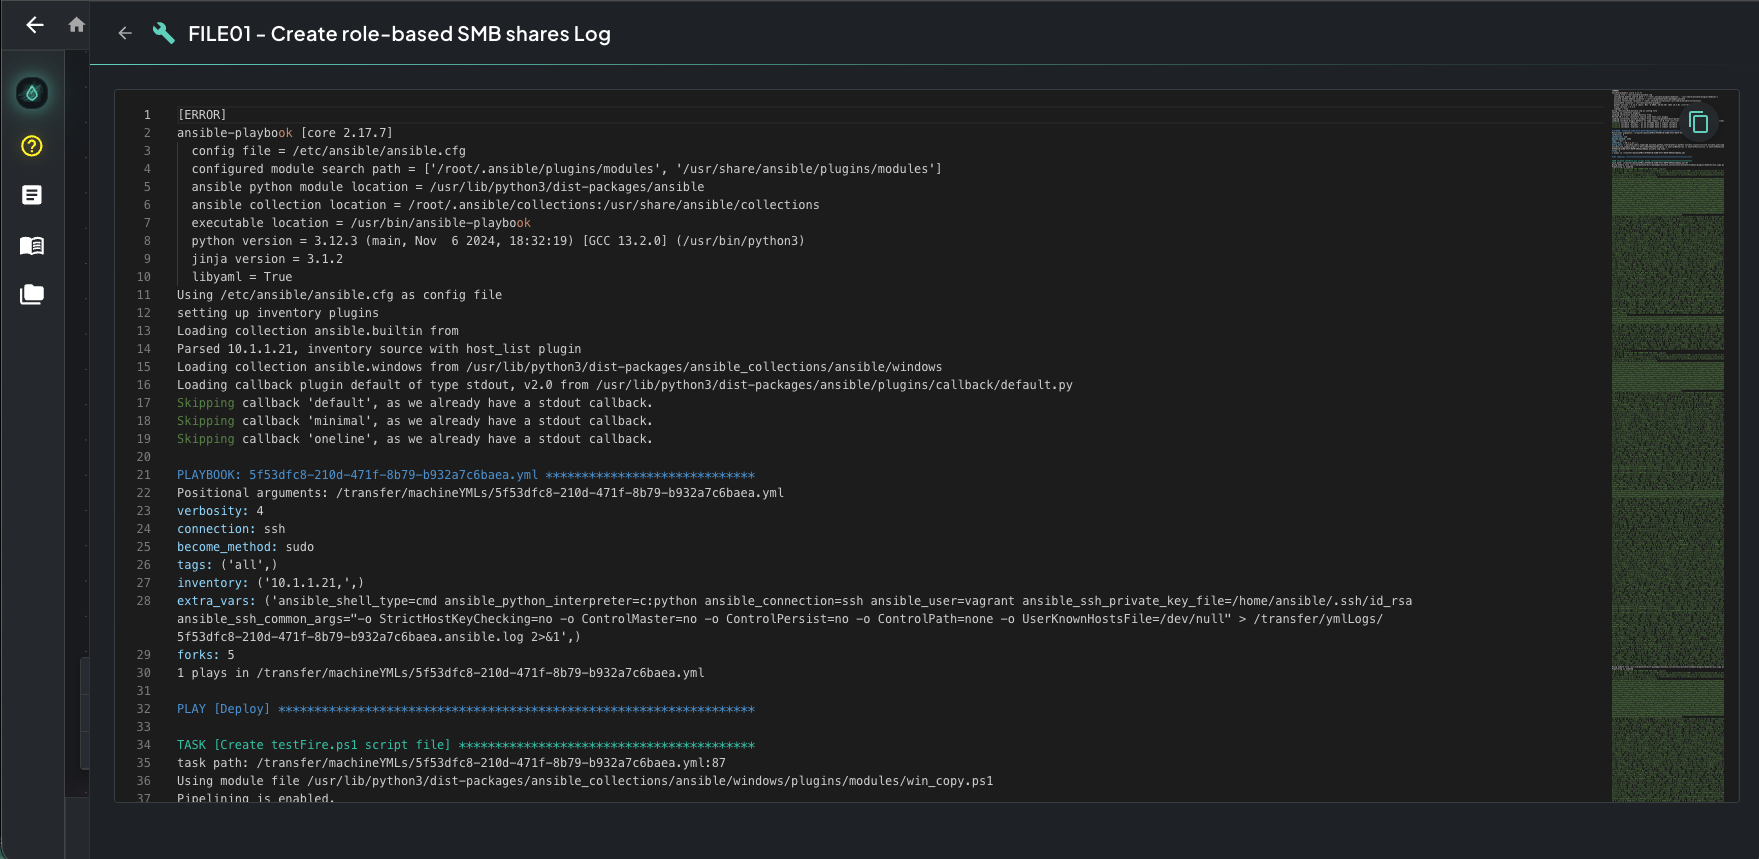 Top of the play log — Ansible boot, module discovery, and the first tasks. The error is rarely here; keep scrolling.
4. Scroll to the bottom. Ansible runs every task in the play before stopping, so the actual error (the line that explains why the play failed) is almost always at the very bottom. Look for the last FATAL: [hostname]: line — the message and module output below it is your real failure reason, followed by the PLAY RECAP summary.
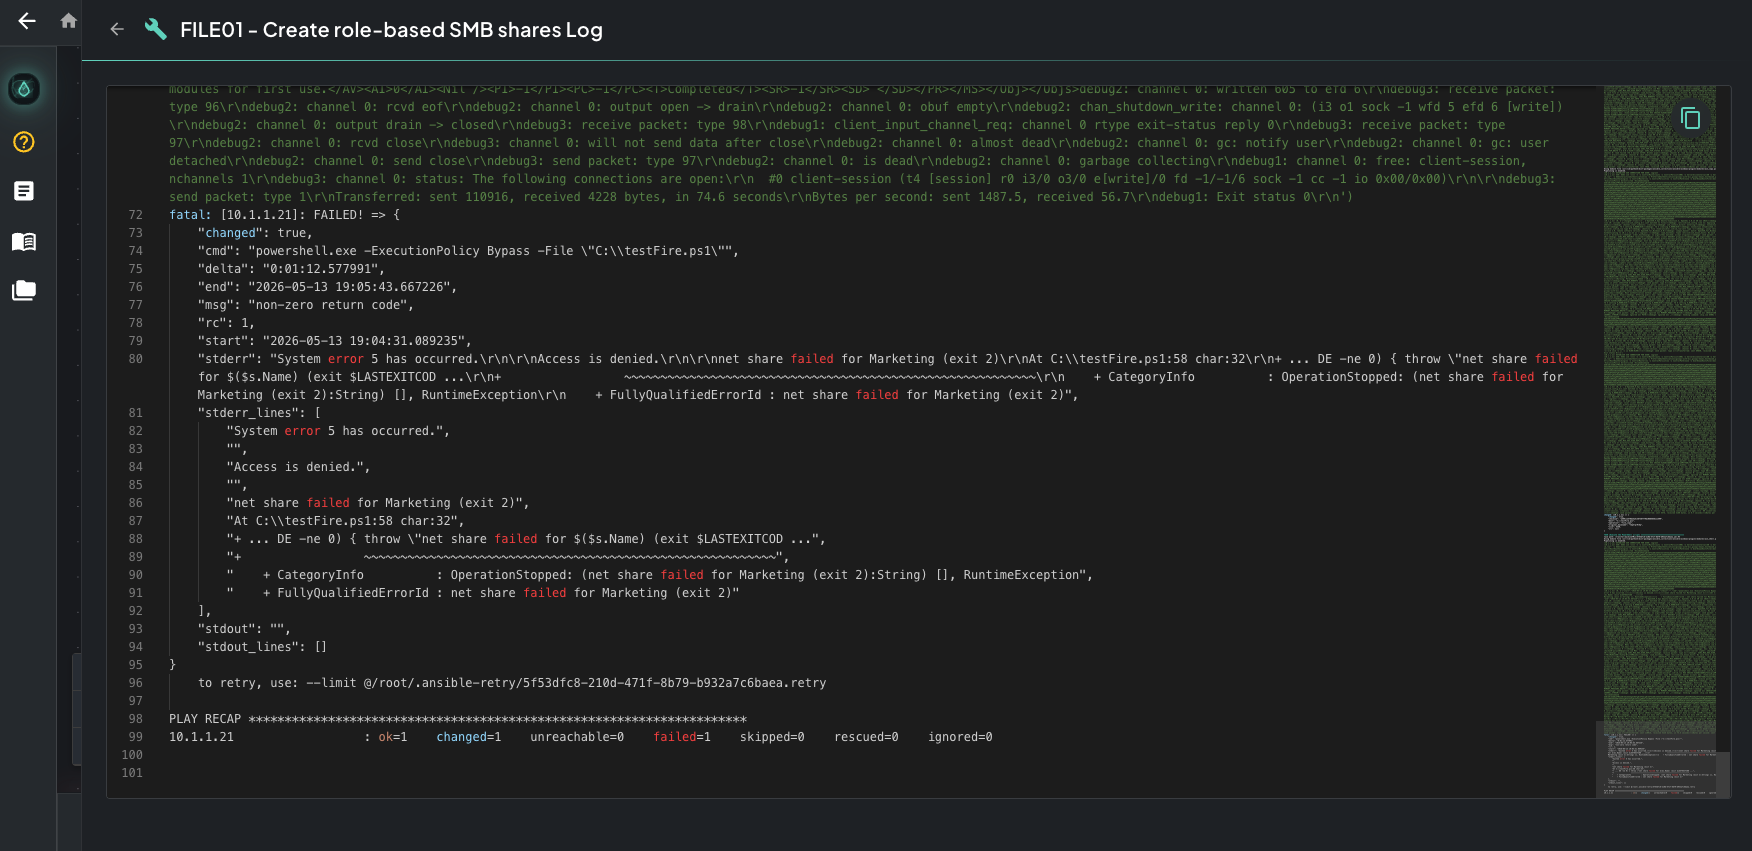 Bottom of the play log — the last FATAL block and PLAY RECAP. That’s your real failure reason every time.
If the bottom of the log isn’t enough to identify the cause, redeploy with Verbose Logging on for the full -vvvv Ansible output (variable values, connection details, module arguments, full tracebacks).
After diagnosing the issue
Section titled “After diagnosing the issue”Once you know why the build failed, you have two options — keep the deployment and recover from a checkpoint, or tear everything down and start fresh.
Redeploy Build
Reverts every VM to the last checkpoint and resumes with your fix applied. Best for plugin tweaks, parameter changes, or small canvas edits.
Remove Build
Tears down all infrastructure and returns the canvas to design mode. Use for a fresh start — every VM and any unsnapshotted state is destroyed.
Verifying completion
Section titled “Verifying completion”The clearest signal that everything worked is a single button: Create Machine Templates appears in the top right of the canvas. If you see it, every play across every machine ran cleanly with no errors — the build is 100% complete and ready to templatize.
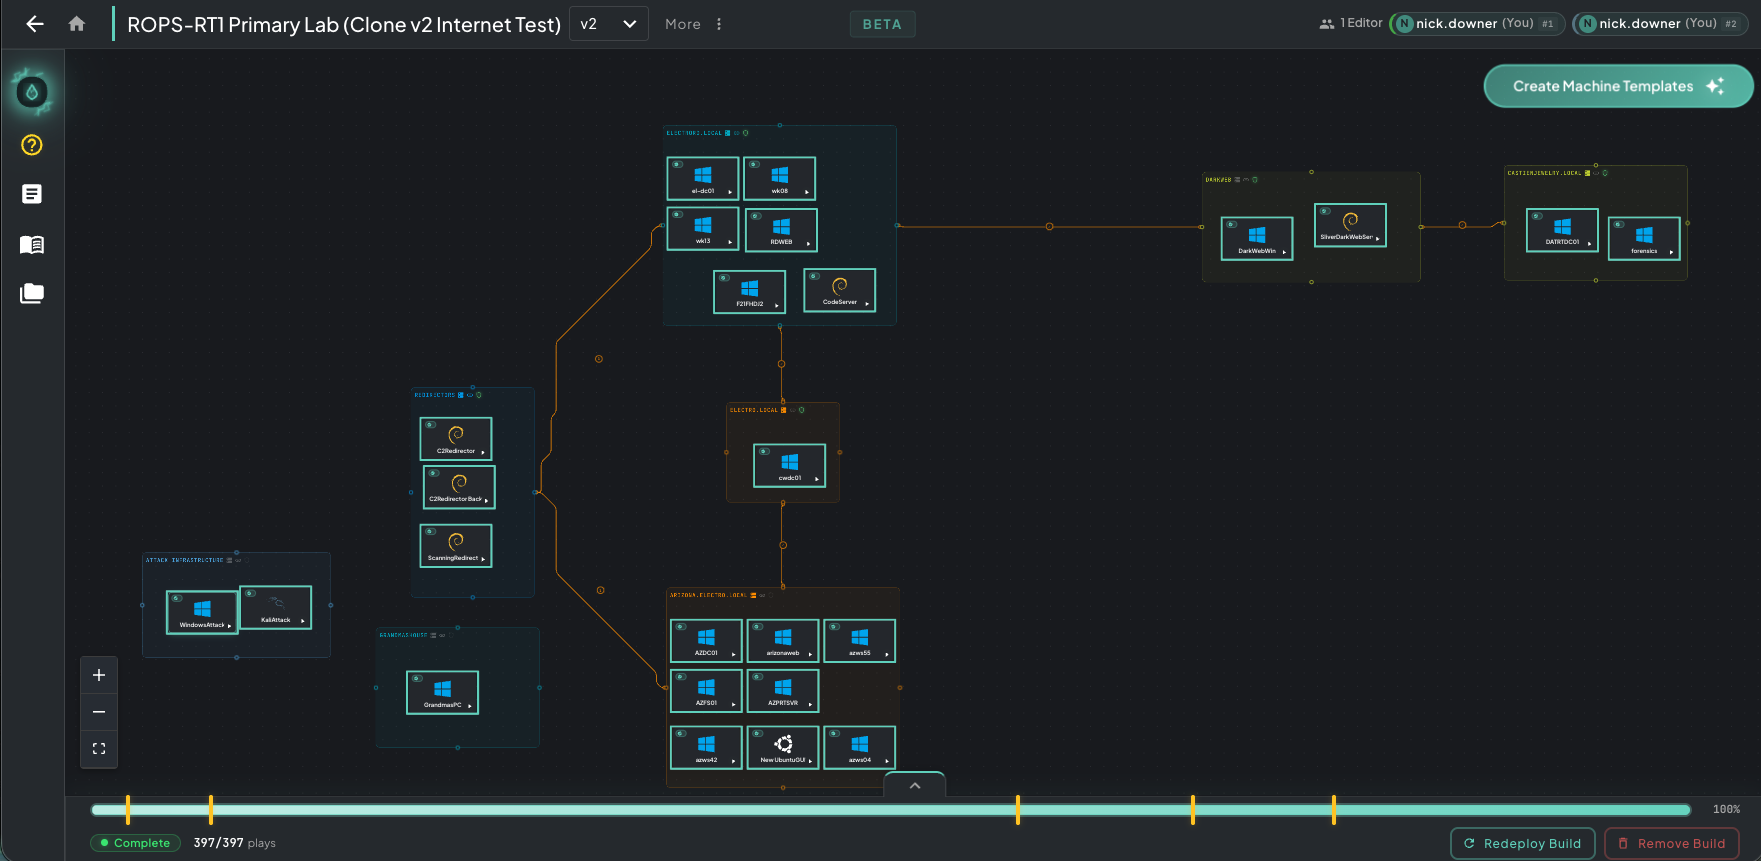 Build complete — every machine green, status pill reads Complete, and the Create Machine Templates CTA in the top right is your green light to move on.